Table & Explorer
Find the request that changed the screen, even when a refresh starts dozens of transfers.
1. Live Table View
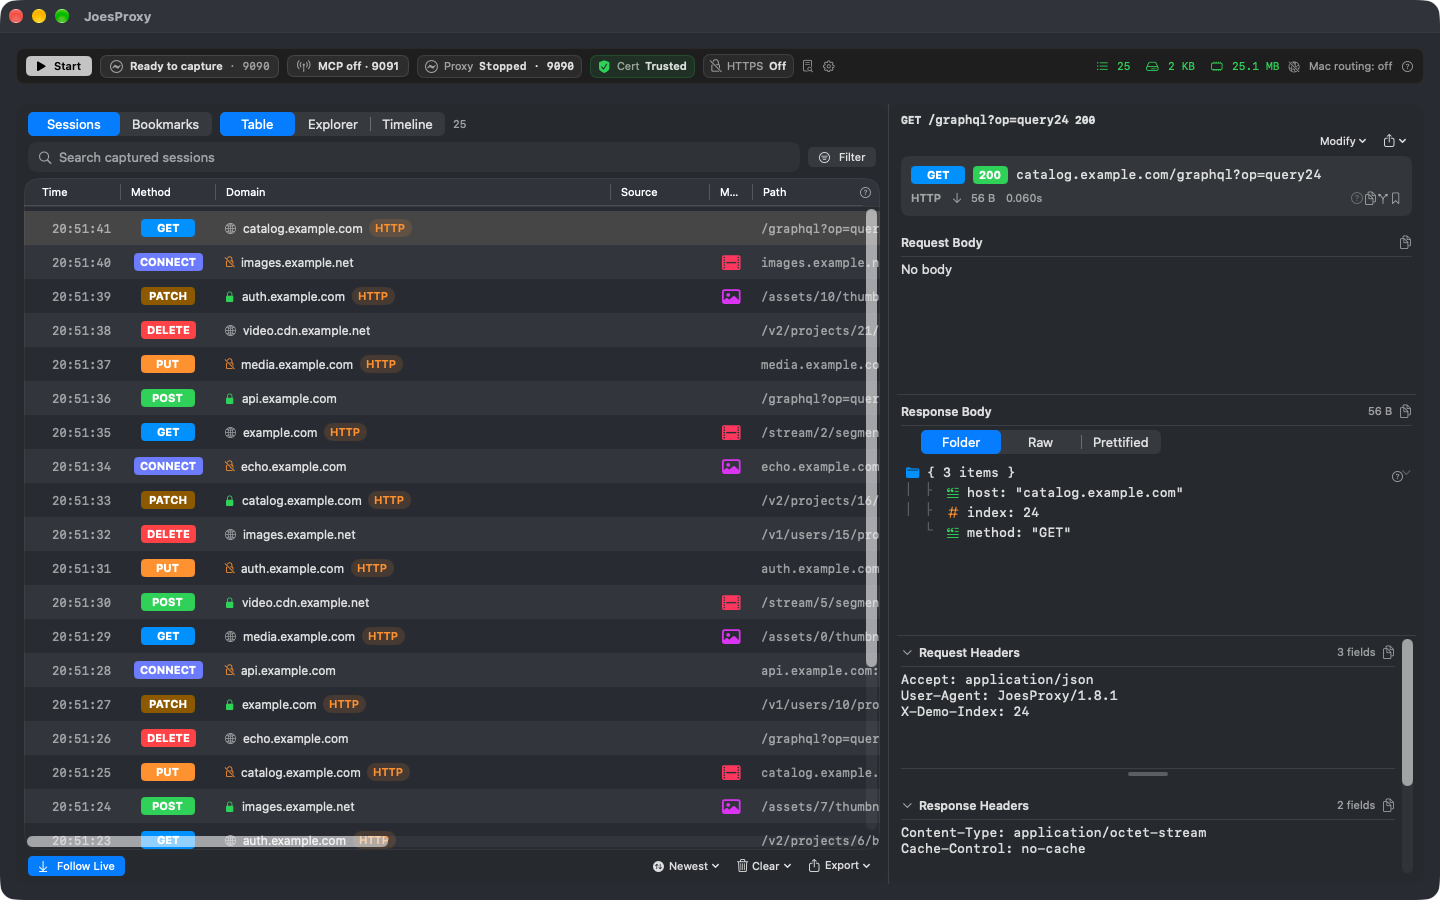
The Table view presents a flat, chronological stream of network events as they traverse the proxy engine:
- Columns: Status Code, HTTP Method, Host, Path, Response MIME Type, Content Length, Transfer Duration, and Source Target.
- Visual Status Markers: HTTP 2xx (green), redirects 3xx (blue), client errors 4xx (amber), server faults 5xx (red), and socket aborts.
- Filtering: Narrow retained sessions by host, status, method or content type. Filtering and display costs vary with the retained dataset.
2. Hierarchical Host Tree (Explorer View)
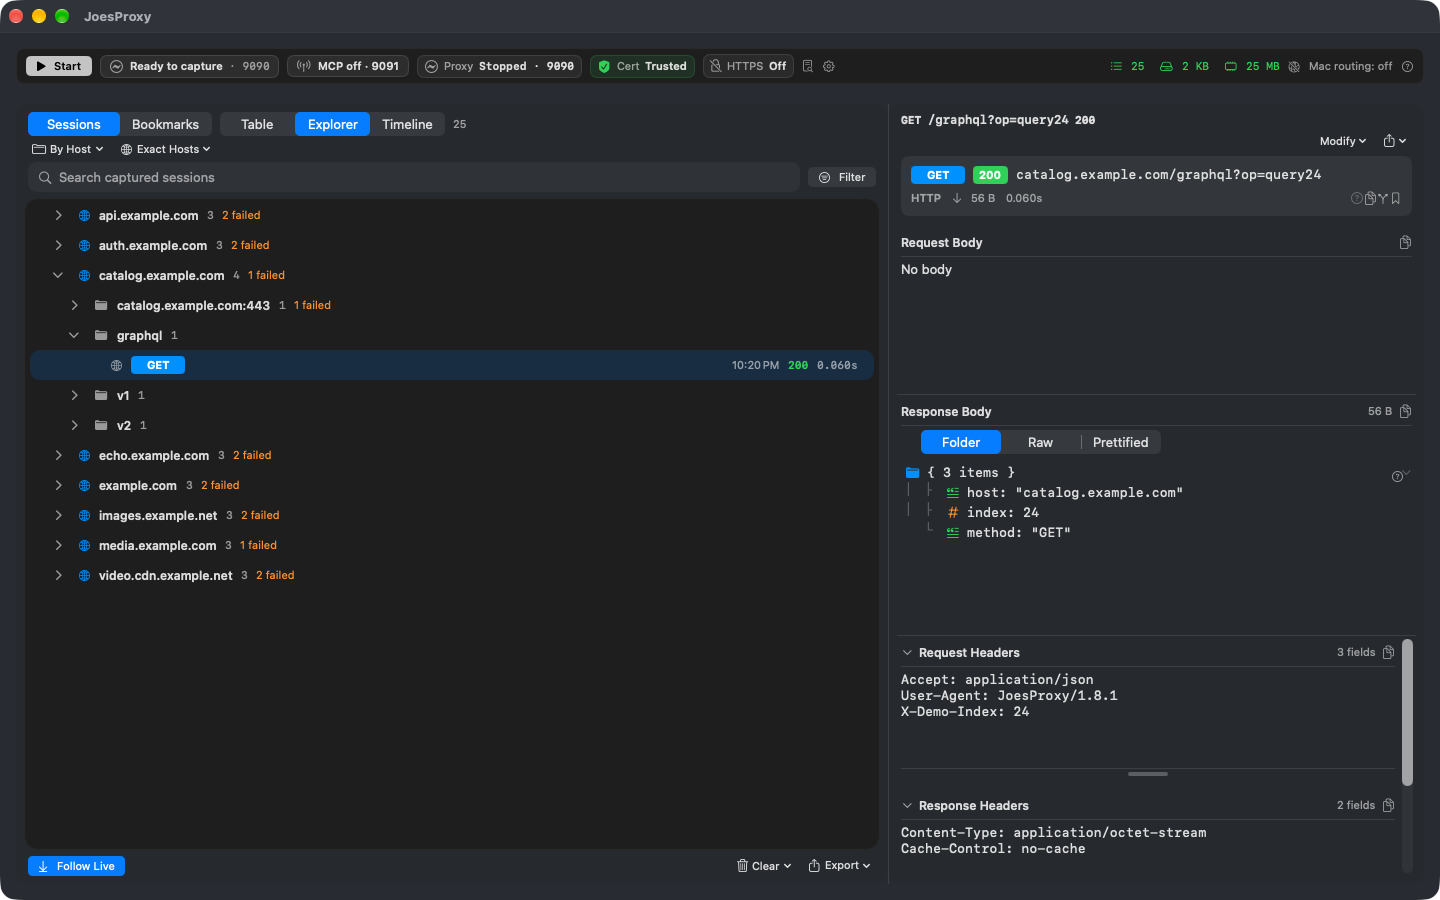
When modern web and mobile apps fire dozens of concurrent API calls, analytics pings, and asset requests, a flat list can become overwhelming. Explorer view automatically structures sessions into an interactive domain and path tree:
- Groups requests logically by
Host → Path Segments → Endpoints. - Isolate your app’s core API endpoints from third-party metrics and CDN noise with a single click.
- Expand and collapse entire API namespaces to trace full endpoint lifecycles.
Deep Request & Response Inspector
Clicking any request opens the deep inspector pane, designed for rapid analysis:
- Headers & Cookies: Formatted table of request/response headers with raw mode copy.
- JSON Tree & Formatted Text: Syntax-highlighted, collapsible JSON viewer with search, key path copying, and validation warnings for malformed payloads.
Try it
Refresh the catalog once. Find its host in Explorer, then use the Table to see where the artwork request fell relative to the catalog response. Compare the returned artwork URL with the path the app actually requested.
Follow one action rather than the whole capture
Set up the target, note its device and trigger one catalog refresh. Use Table to inspect the chronology, Explorer to compare all requests to one host or normalized endpoint, and the inspector to examine the exact request. If two rows have the same path, compare method, time and status before drawing a conclusion. Follow the same working set into Timeline to see relative order.
FAQ: is the reported size the body I can export?
Not necessarily. Check whether the connection was inspected and whether the body is retained, deferred, omitted or truncated. A content length is not an availability indicator. If the body is required, repeat with synthetic data and appropriate capture settings. Review headers, cookies and identifiers before sharing even a metadata-only excerpt.
Finish
Remove the temporary filters and verify that the device is back on its original route. Keep a recording only if the next investigator needs the captured request.